Executive Summary

Contents
- Executive Summary
- Global betting market: Industry metrics
- User demographics: Who's placing bets?
- Global betting behavior & activity metrics
- Global betting numbers: Sports popularity or what are people betting on?
- Technology: The digital transformation of global betting
- Marketing & employment: Industry economics
- Conclusion: The Future of global sports betting
Best Bookmakers for United States
KEY STATISTICS
- 66% of bettors worldwide maintained or increased their online betting activity. (TGM Research)
- $354.89 billion – projected global market value by 2032 .(Data Bridge)
- 314.5 million users expected by 2030. (Statista)
- 19% of bettors globally wager several times per week (TGM Research)
Global betting market: Industry metrics
The global betting landscape is undergoing a massive transformation, evolving from a niche pastime into a dominant pillar of the international entertainment economy.
Market size and projections:
- Valued at $175.51 billion in 2024, the worldwide sports betting market is expected to surge to $354.89 billion by 2032, more than doubling in size over the eight-year period. (Data Bridge)
- Between 2024 and 2025, the sports betting industry experienced an 11% annual growth rate. (technavio)
- From 2025 to 2032 the market is projected to grow at a 9.2% CAGR, primarily due to more legalization of betting and the expansion of online betting platforms.(Data Bridge)
Digital dominance:
- 77% of bettors in 2024 placed wagers online or through mobile apps, compared to just 23% who bet in person at physical sportsbooks. (TGM Research)
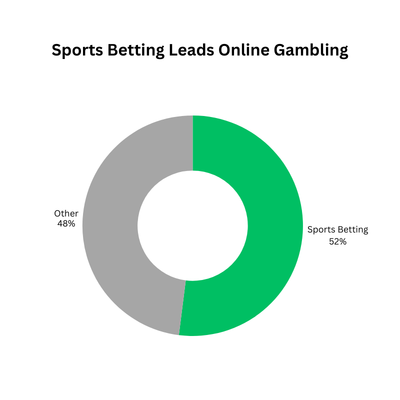
- In 2025, sports betting dominated the online gambling market, accounting for just over half of all activity at 52.05% (Mordor Intelligence)
Revenue metrics:
- In the US, the average revenue per user (ARPU) climbed to $33.59 in 2024, with expectations of $34.90 in 2025.(ESI)
- Worldwide, sports betting revenue per user is projected to reach $318.24. (Statista)
- The illegal sports betting market share in the U.S. has declined significantly from 36% to 24%, indicating successful regulatory frameworks. (AGA)
User demographics: Who’s placing bets?
The sports betting audience is expanding rapidly, with projections indicating substantial growth in both volume and market penetration:
- The global sports betting market is projected to reach 314.5 million users by 2030. (Statista)
- Sports betting user penetration is projected to grow from 3.5% in 2026 to 3.9% by 2030. (Statista)
Age distribution
Understanding the age demographics reveals important insights about market evolution:
- The 25-34 age group represented 34.10% of global users in 2025.(Mordor Intelligence)
- The 18-24 age group is expected to grow fastest, with an 11.98% CAGR from 2026 to 2031, signaling strong youth adoption. (Mordor Intelligence)
- Esports betting on games like League of Legends, Dota 2, and Counter-Strike 2 attracts mostly young people aged 18 to 34. (MordorIntelligence)
Gender and income breakdown:
- Nearly seven in ten American bettors (69%) are male.(IPSOS)
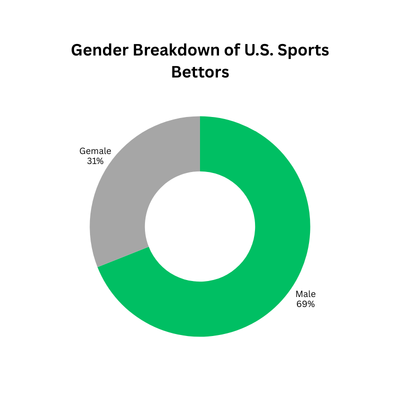

- In the U.S., 12% of women place sports bets at least once a month, indicating growing female participation. (PlayNJ)
- American sports bettors span all income levels, demonstrating the broad appeal of sports wagering. (IPSOS)
| Income Level | Percentage of Bettors |
| $100K+ | 44% |
| $50K-<$100K | 25% |
| Under $50K | 31% |
Regional insights:
- 26% of UK adults are planning to bet in 2026, showing sustained interest in mature markets. (OLBG)
- Africa leads globally in sports betting frequency, with 52% of bettors wagering weekly and 24% betting monthly. (TGM Research)
- Platform loyalty remains low, with only 4% of users staying with one site for over a year, highlighting the competitive nature of customer acquisition. (Scaleo)
Global betting behavior & activity metrics
Regional sports betting trends vary, with differences evident in how often users bet, which betting formats they choose, and their overall engagement.
- Nearly one in five bettors worldwide (19%) wager several times per week, with African countries showing the highest participation rates. (TGM Research)
| Region | EU | APAC | MENA | Africa | N.America | LATAM |
| Betting frequency: A few times a week | 16% | 17% | 20% | 31% | 12% | 17% |
Table: Sports betting frequency per region
*APAC (Asia-Pacific): 1) East Asia (China, Japan, South Korea) 2) Southeast Asia (Singapore, Indonesia, Thailand, Vietnam, etc.) 3) South Asia (India, Pakistan, Bangladesh) 4) Oceania (Australia, New Zealand)
** MENA (Middle East and North Africa): 1) Middle East: Saudi Arabia, UAE, Qatar, Israel, Jordan, Iraq, Iran, Kuwait, Oman, Bahrain, Yemen 2) North Africa: Egypt, Morocco, Algeria, Tunisia, Libya
- Live sports betting held a 62.35% share of the online wagering market in 2025 and continues to expand at a 13.62% CAGR through 2031. (Mordor Intelligence)
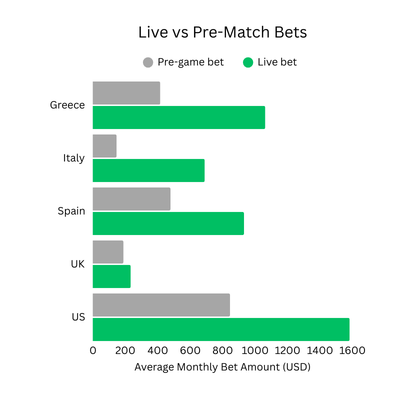
- In Greece, Italy, Spain, the United States, and the United Kingdom, more than half (54%) of monthly betting volume comes from live wagering, with pre-match bets representing 46%. (GlobalNewsWire)
- Live bettors outspend pre-match bettors in average monthly wagers.
- 52% of bettors use cash-out while betting on live sports.(GREO)
- Major international tournaments generate up to a 200% spike in betting activity relative to non-tournament periods. (IGB)
Wagering patterns:
- In 2025, the average sports bet worldwide was between $262 and $452. (SBCAmericas)
- The majority of US sports bettors (63%) use multiple online betting platforms, indicating price-shopping behavior. (SBU)
- On betting sites that accept both fiat currency and crypto, over 30% of bets are made with cryptocurrency. (Gitnux)
Regional betting preferences
Bettor tolerance for betting margins varies significantly by region:
- Latin American bettors accept 8-10% margins in some sports. (Altenar)
- European bettors typically reject anything over 5%. (Altenar)
Global betting numbers: Sports popularity or what are people betting on?
Betting interest varies significantly across different sports, with some disciplines and events regularly generating higher wagering activity and participation.
Leading sports by betting volume:
- Soccer was the most bet-on sport in the US in 2023, with over $800 billion in bets. (Statista)
- Worldwide, football is the top betting sport and is projected to grow at 11.91% annually through 2033. (Straits Research)
- Big tournaments such as the FIFA World Cup, UEFA Champions League, and national leagues draw considerable wagering interest. (Straits Research)
Fastest-growing betting categories:
- By 2030, the esports betting industry is forecasted to hit $21.61 billion, growing at an annual rate of 11.1%. (The BusinessResearchCompany)
- Tennis betting will grow faster than any other sport at 13.83% annually until 2031. Two-week Grand Slam events across different time zones keep live betting active around the clock. (MordorIntelligence)
- The FIFA World Cup is the most anticipated sports event of 2026 in the UK, with 34% of people interested. (OLBG)
Technology: The digital transformation of global betting
Technology is revolutionizing sports betting, with mobile applications enabling real-time wagering and artificial intelligence streamlining player engagement and operational efficiency.
Desktop vs. mobile:
- Desktop had 55.75% of the online betting market in 2025, while mobile is expected to grow 13.75% yearly through 2031. (MordorIntelligence)
- North America has become a major market for mobile sports betting applications.(DataIntelo)
Modern mobile betting apps now include advanced features that streamline the user experience: a) Geolocation verification for regulatory compliance b) Biometric authentication for security c) Push notifications for live events to drive engagement
These technological advances enable users to place bets in under 10 seconds (MordorIntelligence)
User behavior by platform:
- Mobile users: Casual bettors who place small, simple wagers on single outcomes.
- Desktop users: More sophisticated bettors who employ statistical models, monitor multiple live events simultaneously, and execute arbitrage strategies across different operators. (MordorIntelligence)
Artificial Intelligence integration:
- In 2025, AI placed almost half of all bets on certain networks, representing a fundamental shift in market dynamics. (Kambi)
Marketing & employment: Industry economics
Understanding what motivates bettors to choose platforms provides crucial insights for operators:
- 65% of bettors identify bonuses as the main factor motivating them to register with a new betting platform. (Gitnux)
Marketing investment case study: The industry’s leading operators invest heavily in brand awareness and customer acquisition. Bet365’s estimated annual marketing spend of $450M–$550M is distributed as follows (Scaleo):
- 50% – TV & Radio advertising
- 25% – Online advertising
- 15% – Sponsorships
- 10% – Promotions & bonuses
Employment metrics:
- The global sports betting and lotteries sector employed approximately 177,327 people in 2024, reflecting the industry’s growing economic significance. (IBIS)
Conclusion: The Future of global sports betting
The sports betting industry stands at an inflection point, with digital transformation, regulatory evolution, and technological innovation converging to reshape how millions of people engage with sports worldwide.
As the industry matures, operators who can combine technological innovation with responsible gaming practices while navigating complex regulatory environments will be best positioned to capture market share in this rapidly evolving landscape.
Latest Tips
Sydney Swans vs Gold Coast Suns Prediction on April 11, 2026
Here’s a breakdown of the Sydney Swans vs Gold Coast Suns matchup in the 2026 Australian Football League home-and-away season, Round 5, Gather Round. It’s one of the standout interstate tests of the...
Read MoreAtlanta Braves vs Cleveland Guardians Prediction on April 10, 2026
Here’s a breakdown of the Atlanta Braves vs. the Cleveland Guardians regular-season matchup for the 2026 Major League Baseball, focusing on the first game of the series on Friday, April 10, 2026. Th...
Read MoreXRock vs Wolves Esports Prediction on April 9, 2026
This is a meaningful regular-season match because it pairs a mid-table side still trying to steady its campaign with one of the stronger teams in the field – both Chinese sides – in a bo5. The Sprin...
Read MoreKT Rolster vs Nongshim RedForce Prediction on April 9, 2026
This early-season matchup in the League of Legends Champions Korea (LCK) is more important than it might look at first glance. In a format where every best-of-three series contributes directly to gr...
Read MoreLatest News
“Ruler” Hit with Tax Evasion Fine — What Happens Next for LoL Superstar?
One of League of Legends’ most recognizable names has unexpectedly found himself in controversy. Park “Ruler” Jae-hyuk has been fined following a tax dispute in South Korea, and while the financial si...
Read MoreAlberta Prepares to Launch New iGaming Market — What It Means for Sports Betting
Alberta is on the verge of a major shift in its gambling landscape, as the province moves closer to launching a fully regulated iGaming and online sports betting market. Long dominated by a single gov...
Read MoreCS2 Player “nifee” Banned for Match-Fixing — Handed Down 4-Year Suspension
The Counter-Strike 2 scene has been hit by another integrity scandal, with Dmytro “nifee” Tediashvili receiving a four-year ban after an ESIC investigation uncovered match-fixing activity tied to bett...
Read MoreSteven Gerrard Joins WE88 as Global Ambassador Ahead of World Cup 2026
Football icon Steven Gerrard is stepping into a new role off the pitch, joining WE88 as a global brand ambassador in a move that aligns closely with the build-up to the 2026 FIFA World Cup. The former...
Read More
